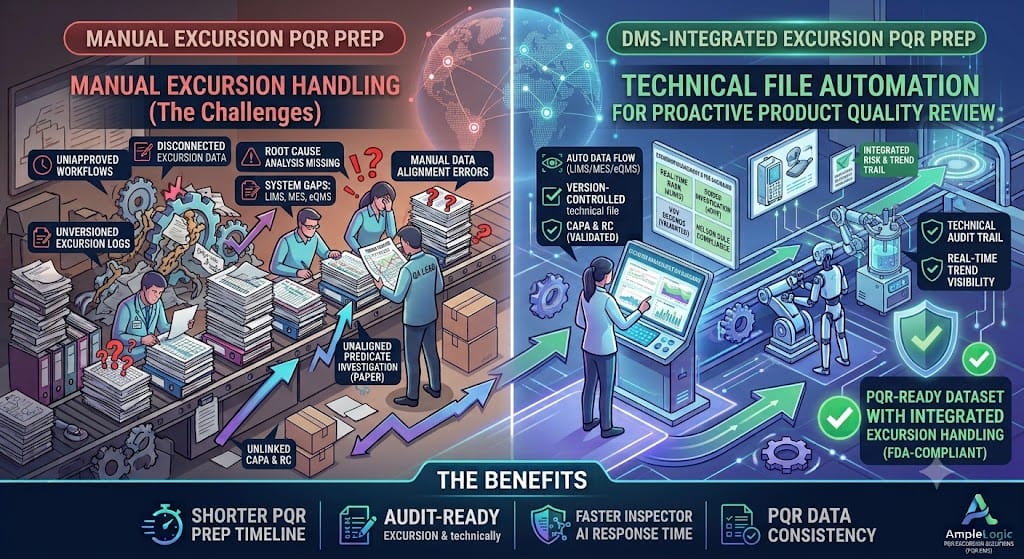
An excursion, whether it's a temperature spike during storage, a process parameter that briefly drifts outside its control limit, or an environmental monitoring result that trends upward, is exactly the kind of signal a quality review is supposed to catch. The problem is that in a lot of pharmaceutical operations, excursions are logged in one place, investigated in another, and the annual or periodic quality review is compiled from a third. By the time someone connects the dots, the trend has already repeated itself two or three more times.
Why excursions get lost between systems
Manufacturing captures the excursion. Quality logs the deviation. The lab records the result. None of these are wrong on their own, but if they aren't structured to feed the same downstream review, the person compiling the Annual Product Quality Review has to manually go find each one, match it to the right batch and parameter, and decide whether it belongs in the trend analysis. That's slow, and it's also where excursions quietly fall out of the picture.
What automated excursion handling changes
Built into AmpleLogic's APQR software, automated excursion handling connects the moment an excursion occurs to the review that's supposed to analyze it:
Excursions captured in LIMS, MES, or eQMS flow directly into the relevant product's quality review dataset, without a manual export step
Batch-wise trending and I-chart visualizations show control limits, specification limits, and statistical trend lines together, so an excursion is immediately visible in context
Nelson Rule violation detection flags patterns across multiple excursions that wouldn't be obvious looking at any single event in isolation
Root cause and CAPA links stay attached to the excursion record as it flows into the review, so the reviewer sees not just what happened but what was done about it
From individual incidents to real trend analysis
The value here isn't just faster paperwork. It's the difference between a quality review that lists excursions and one that actually analyzes them. When every excursion automatically carries its process context, its statistical position relative to control limits, and its investigation outcome into the same review, patterns that would take a person weeks to notice by comparing spreadsheets become visible in a single chart. That's what regulators mean when they talk about a quality system that's proactive rather than reactive.
Keeping the review inspection-ready
Because the excursion data, the statistical analysis, and the review conclusions all come from the same connected platform, there's no separate reconciliation step to defend during an inspection. The review shows exactly where each number came from, which supports the kind of traceability FDA, EMA, and WHO inspectors expect to see in a PQR.
If your excursion data currently lives in three different systems before it reaches your quality review, the APQR software page walks through how the integration works with your existing LIMS, MES, and eQMS.


