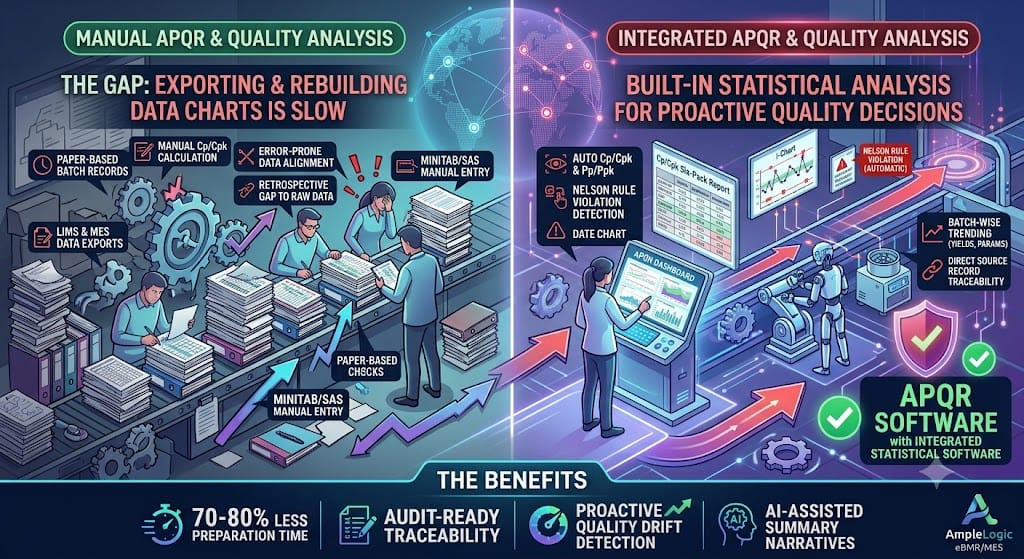
Statistical analysis has always been central to a defensible Annual Product Quality Review: process capability indices, control charts, trend lines, and the judgment calls a QA reviewer makes based on them. What's changed is how much of that analysis still depends on manually exporting data into Minitab, SAS, or a spreadsheet-based macro, reformatting it, and rebuilding the same charts every review cycle.
The gap between the data and the analysis
In a typical setup, LIMS holds the results, MES holds the process parameters, and neither one produces a Cp/Cpk chart on its own. Someone has to pull both data sets, align them by batch and date, and run them through a separate statistics tool. That extra step is where reviews slow down, and it's also where transcription errors sneak into numbers that regulators expect to trust.
What built-in statistical capability looks like
AmpleLogic's APQR software runs the statistical analysis inside the same platform that aggregates the underlying data, which removes the export-and-rebuild cycle entirely:
Cp/Cpk/Pp/Ppk process capability analysis generated directly from connected LIMS, MES, and eQMS data
Built-in Six-Pack reports and I-chart visualizations with control limits, specification limits, and trend lines rendered together
Nelson Rule violation detection that flags statistically meaningful patterns automatically, rather than relying on a reviewer to spot them by eye
Batch-wise trending across granulation yield, compression yield, coating, and packing metrics without a separate data pull for each
Why this matters more than it sounds
The practical effect isn't just saved time, though 70 to 80 percent less time spent on review preparation is a common outcome. It's that the statistical output is generated from the same source records an inspector can pull directly, rather than a recreated version built in a disconnected tool. That closes a traceability gap that shows up more often in inspections than most QA teams expect: an inspector asking to see the raw data behind a chart, and the team needing time to go find it because the chart was built somewhere else.
Supporting proactive quality decisions, not just retrospective ones
When statistical analysis is available continuously rather than compiled once a year, it stops being purely a historical exercise. AI-assisted summary narratives can flag developing trends between formal review cycles, giving QA the chance to act on a drift before it becomes a deviation. That shift, from a once-a-year statistical snapshot to ongoing statistical visibility, is where a lot of the real value in modern APQR software actually sits.
To see how the statistical analysis connects to your existing LIMS and MES data, the APQR software page walks through the integration and reporting templates available for your product types and markets.


