Statistical Analyzer
Convert experimental data into actionable insights with statistical modelling, trend and variance analysis, predictive analytics, process capability studies and automated reporting.
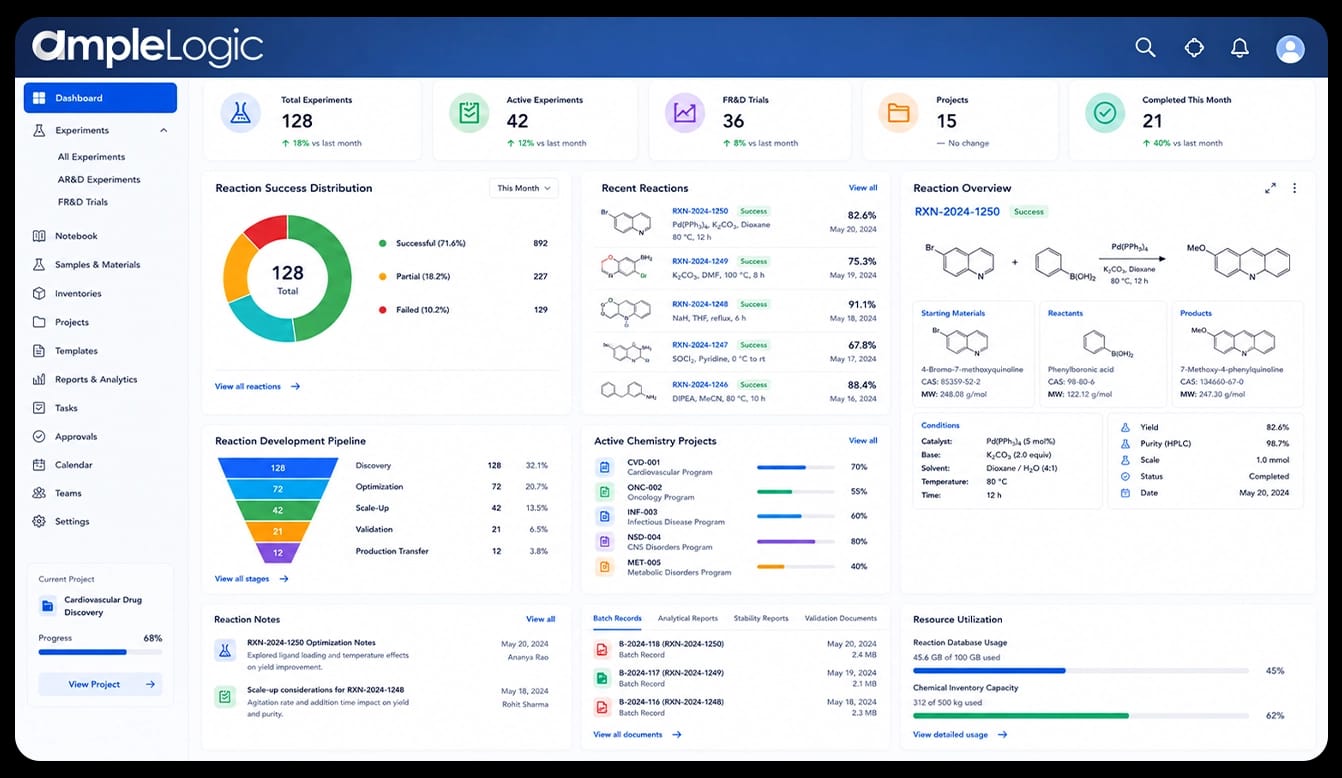
Help scientists interpret experimental results with greater clarity
Collecting experiment data is only part of scientific progress. Without structured analysis, teams struggle to identify trends, variability and meaningful conclusions.
AmpleLogic Electronic Laboratory Notebook includes Statistical Analyzer capabilities for advanced statistical modelling, trend and variance analysis, predictive analytics, process capability studies and automated reporting and visualization.
That helps research and development teams move from raw experimental results to insights that support scientific decisions and reporting.
Explore AmpleLogic Electronic Laboratory NotebookWhat Statistical Analyzer enables
Practical capabilities research teams use to manage scientific work in the ELN.
Advanced Statistical Modelling
Apply statistical modelling to experimental data to support deeper scientific interpretation.
Trend and Variance Analysis
Identify trends and variability across experimental results to understand process behavior.
Predictive Analytics
Use predictive analytics to support forward-looking interpretation of experimental outcomes.
Process Capability Studies
Support process capability evaluation as part of scientific and development analysis.
Automated Reporting and Visualization
Generate reports and visualizations that make analytical findings easier to communicate.
How this capability fits the research lifecycle
From create and review through approval, distribution, use, revision and archival — adapted for this page.
Step 01
Collect experiment data
Bring experimental results from executed studies into analysis-ready context.
Step 02
Model and analyze
Apply statistical modelling, trend analysis and variance review to the dataset.
Step 03
Evaluate capability
Assess process capability and predictive indicators where scientifically relevant.
Step 04
Visualize findings
Use automated reporting and visualization to communicate analytical results.
Step 05
Review scientific conclusions
Support scientist and reviewer interpretation before decisions are finalized.
Outcomes researchers and laboratory teams can expect
Benefits focused on this ELN capability.
Faster insight from experimental data
Teams spend less time assembling analyses and more time interpreting scientific meaning.
Clearer trend visibility
Trend and variance analysis help surface patterns that raw tables can hide.
Stronger decision support
Statistical outputs help scientists justify development and research decisions.
Easier communication of results
Automated reporting and visualization improve how findings are shared with stakeholders.
Built to support regulated scientific research and data integrity
Controls and practices most relevant to this ELN capability.
Traceable analysis context
Keep analytical work connected to the experimental records that produced the data.
Audit-ready review support
Support scientific and compliance review of analytical activity history.
Role-based access
Control access to analytical tools and outputs based on user responsibilities.
Analysis that closes the scientific learning loop
Statistical Analyzer connects experiment data, DoE outcomes and audit-ready reporting so insights remain part of the ELN scientific lifecycle.
From data to insight
Interpret experiment and DoE results with statistical modelling and visualization.
From insight to evidence
Support reporting and review with retained analytical context.
See how AmpleLogic can transform your scientific research workflows
Move from fragmented notebooks and disconnected research tools to a more connected, traceable and collaborative electronic laboratory notebook.
Speak with our ELN specialists about your current research workflows, laboratory systems and data integrity requirements.
Unsere globalen Büros
Wir sind dort, wo Sie uns brauchen. Global verbunden, lokal geliefert.
Indien

Melange Tower, 2nd Floor, Wing-C, Patrika Nagar, HITEC City, Madhapur, Hyderabad - 500081, Telangana, India
Vereinigte Staaten (Dallas)

17330 Preston Road Suite 200D, Dallas, TX, 75252
Kanada (North York, Toronto)

5255 Yonge Street Suite 201, North York, ON, M2N 6P4
Australien (Melbourne)

Level 14, 330 Collins Street, Melbourne, VIC, 3000
Südkorea (Daegu)

Daegu Trade Centre, 8/F. 489, Dongdaegu-ro, Daegu, 41256
Irland (Dublin)

Block 1, Blanchardstown Corporate Park Ballycoolen Road, Dublin, D15 AKK1
Singapur

1 Scotts Road, #24-10 Shaw Centre, Singapore, Singapore, 228208
Bleiben Sie in den Biowissenschaften an der Spitze
Erhalten Sie die neuesten Produktaktualisierungen, Compliance-News und Brancheneinblicke in Ihren Posteingang.