Statistical Process Control (SPC) Tools
Apply control charts, process capability analysis and statistical trending to CPV data so teams can identify abnormal variation, process drift and out-of-control signals with less spreadsheet work.
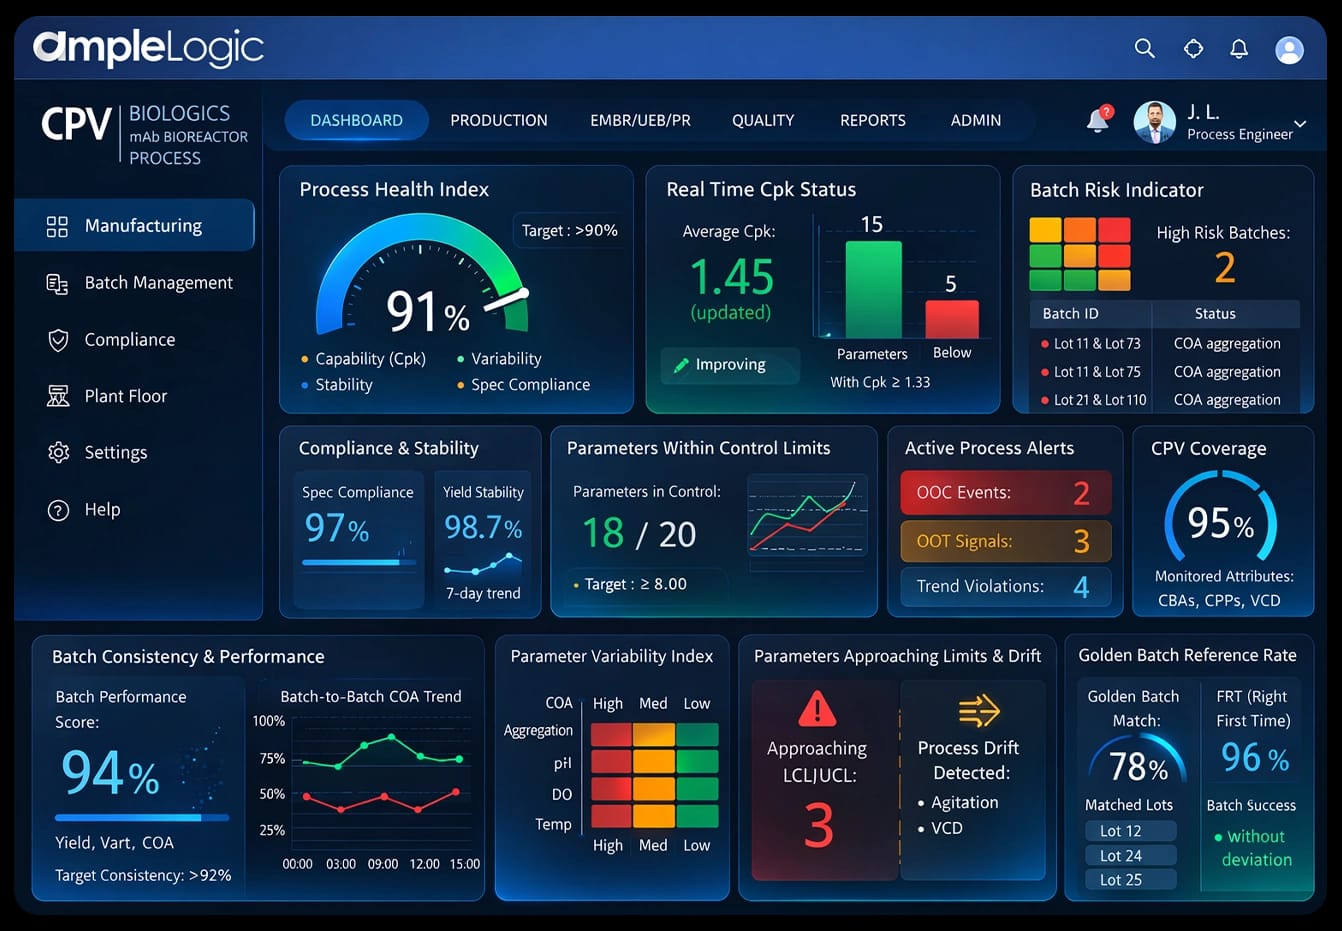
Make process variation visible, measurable and actionable
Statistical Process Control helps pharmaceutical manufacturers understand whether process variation is expected or becoming a risk. Without consistent SPC methods, teams may rely on delayed charting, inconsistent limits or incomplete batch comparisons.
AmpleLogic SPC tools for Continued Process Verification help organizations generate control charts, evaluate process capability, detect trends and review statistical signals from connected process and quality data.
That supports ongoing process control, stronger validation evidence and more confident CPV decision-making.
Back to Continued Process Verification SoftwareWhat Statistical Process Control (SPC) Tools enables
Practical capabilities manufacturing and quality teams use for ongoing process monitoring and process understanding.
Control Charts
Automatically generate and monitor appropriate control charts for process and quality data.
Process Capability Analysis
Evaluate process performance and capability against defined specifications or limits.
Trend Detection
Identify meaningful trends and shifts across batches and time periods.
Variation Analysis
Understand normal and abnormal process variation to support quality risk assessment.
Statistical Signals
Identify potential out-of-control conditions and process signals that deserve investigation.
Automated SPC Analysis
Reduce manual statistical analysis and spreadsheet-based monitoring across products and sites.
How this capability fits the CPV lifecycle
From data collection through monitoring, analysis, signal detection, investigation and continuous improvement.
Step 01
Collect
Use monitored CPP, CQA and batch data as the foundation for statistical analysis.
Step 02
Analyze
Apply control charts, capability calculations and variation analysis to process performance.
Step 03
Detect signals
Highlight trends, shifts and potential out-of-control conditions for quality review.
Step 04
Investigate
Support faster assessment of whether variation requires process action or further study.
Step 05
Sustain control
Carry SPC evidence into CPV reporting, process understanding and continuous improvement.
Outcomes quality and manufacturing teams can expect
Benefits focused on this CPV capability — not a generic copy of every monitoring advantage.
Clearer process variation insight
Distinguish expected variation from signals that may indicate process drift.
Faster statistical turnaround
Reduce the time spent building charts and capability summaries by hand.
More consistent SPC methods
Apply common statistical approaches across products, batches and manufacturing sites.
Better manufacturing consistency
Support teams in maintaining ongoing process control and reducing avoidable variability.
Built to support regulated pharmaceutical operations
Controls and practices most relevant to this CPV capability.
Validation-aligned SPC evidence
Support process validation and Continued Process Verification discussions with reproducible statistical views.
Audit-friendly analysis history
Maintain clearer lineage from process data to the charts and signals used in review.
Controlled access to analytics
Use role-based access so statistical monitoring remains available to authorized users.
SPC evidence that strengthens both CPV and APQR
Statistical Process Control supports ongoing verification and also feeds period-based product quality review with reusable charts, capability views and trend conclusions.
Process capability into product review
Capability and trend findings from CPV can inform Annual Product Quality Review conclusions.
Shared statistical language
Use consistent control-chart and capability concepts across monitoring and periodic review.
Our Global Offices
We are where you need us to be. Connecting globally, delivering locally.
India

Melange Tower, 2nd Floor, Wing-C, Patrika Nagar, HITEC City, Madhapur, Hyderabad - 500081, Telangana, India
United States (Dallas)

17330 Preston Road Suite 200D, Dallas, TX, 75252
Canada (North York, Toronto)

5255 Yonge Street Suite 201, North York, ON, M2N 6P4
Australia (Melbourne)

Level 14, 330 Collins Street, Melbourne, VIC, 3000
South Korea (Daegu)

Daegu Trade Centre, 8/F. 489, Dongdaegu-ro, Daegu, 41256
Ireland (Dublin)

Block 1, Blanchardstown Corporate Park Ballycoolen Road, Dublin, D15 AKK1
Singapore

1 Scotts Road, #24-10 Shaw Centre, Singapore, Singapore, 228208
Stay Ahead in Life Sciences
Get the latest product updates, compliance news, and industry insights delivered to your inbox.