Ask a process validation or QA lead how they currently review process performance, and the answer often involves a familiar chain of steps: pull data from different systems, clean up spreadsheets, build charts, check for trends, investigate anything that looks unusual, and eventually turn the whole exercise into a CPV report.
The statistics aren't necessarily the difficult part. Getting reliable data together and making sense of it consistently is.
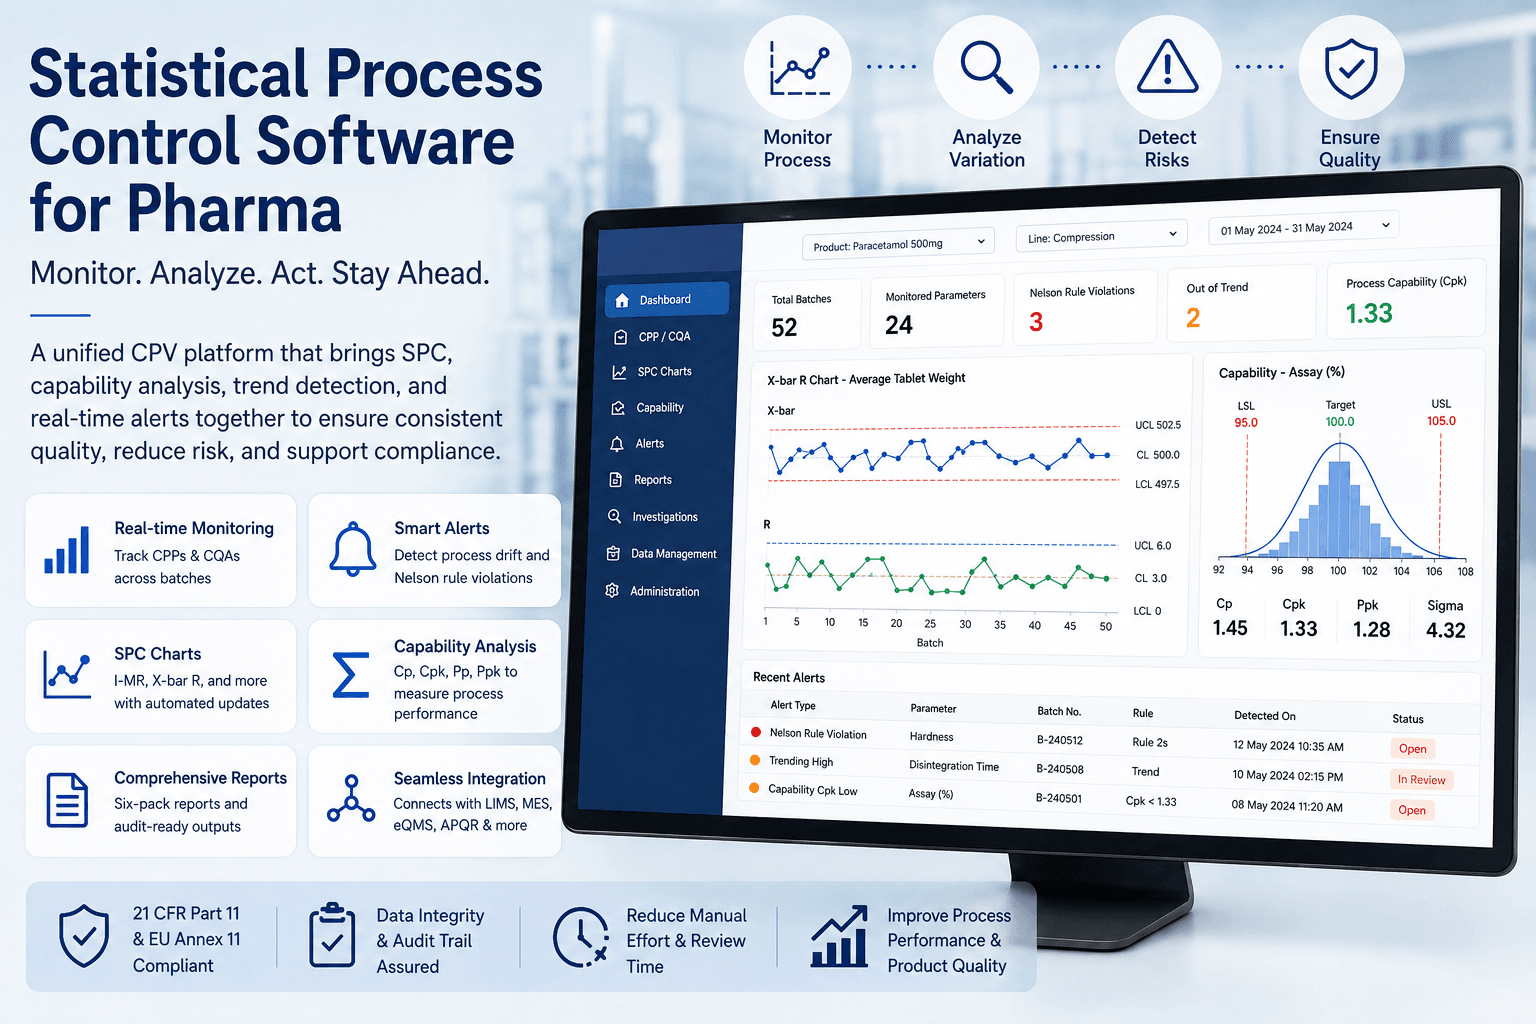
That is where statistical process control software pharma teams can make a real difference. Instead of treating statistical analysis as something that happens after manufacturing data has been collected, a modern CPV platform brings SPC into the process itself. AmpleLogic's Continued Process Verification platform takes this approach by combining CPP and CQA monitoring, automated SPC charting, capability analysis, trend detection, and reporting in one environment.
Why SPC Becomes Difficult as Manufacturing Scales
A single product and a limited number of parameters can be manageable with spreadsheets and statistical tools. Add several products, multiple manufacturing lines, different sites, and hundreds of batches, and the process changes quickly.
Data may be sitting in LIMS, MES, ERP systems, instruments, and spreadsheets. Someone then has to bring it together before the actual analysis can begin. AmpleLogic identifies this fragmentation as one of the practical challenges in CPV, particularly because disconnected data can delay trend detection and make process verification more resource-intensive.
The result is a process that can become more reactive than proactive.
By the time a trend is noticed, the team may already be looking at several batches of historical data rather than catching the shift when it first appeared.
A statistical process control platform changes that workflow by bringing the data and analysis closer together.
What Should Statistical Process Control Software Pharma Teams Actually Do?
The answer isn't simply "draw control charts."
A useful platform needs to help quality and manufacturing teams understand whether a process is behaving as expected and, more importantly, whether that behavior is changing.
That means looking at:
CPPs and CQAs across batches and products
Control charts for identifying unusual process behavior
Capability indices such as Cp, Cpk, Pp, and Ppk
Process sigma for understanding performance
Nelson Rule violations that may indicate non-random variation
Trend analysis to identify gradual deterioration
Alerts when defined thresholds or patterns are crossed
Historical comparisons between batches and process conditions
AmpleLogic's CPV platform supports I-MR and X-bar R charts, capability analysis, six-pack reports, Nelson Rule detection, and both univariate and multivariate statistical analysis.
That distinction matters. The objective isn't to generate more graphs. It's to make the graphs useful enough that teams can act on what they show.
The Problem With Treating Every Deviation as a Surprise
One of the less obvious benefits of SPC is that it gives teams another way to look at process behavior.
A batch can meet its specification and still tell you something worth investigating.
Maybe a compression parameter has been moving gradually toward its upper range. Perhaps a moisture value is still acceptable but has started behaving differently from previous batches. Or a capability index is weakening even though there hasn't been an OOS event.
These aren't necessarily failures. They're signals.
This is where statistical process control becomes particularly useful in pharma manufacturing. Control charts, capability analysis, and rule-based detection can help teams distinguish normal variation from patterns that deserve attention. AmpleLogic's CPV platform also provides automated alerts for process drift, Nelson Rule violations, and capability deterioration.
From Manual Minitab Reviews to an Integrated CPV Workflow
Minitab and other statistical tools have their place. The problem starts when the statistical analysis sits completely outside the rest of the quality workflow.
A typical manual process might look something like this:
Export manufacturing and laboratory data.
Clean and organize the dataset.
Load it into a statistical tool.
Generate charts and capability calculations.
Review the results.
Copy relevant findings into a CPV report.
Repeat the exercise for the next reporting period.
There is nothing inherently wrong with the methodology. The amount of manual handling is the concern.
AmpleLogic's CPV platform is designed to automate SPC charting, statistical calculations, reporting, and data ingestion from systems such as LIMS, MES, ERP, and manufacturing instruments. Its stated goal is to replace manual CSV exports and Minitab-based charting with an automated and auditable statistical workflow.
For a QA team managing CPV across several products, that can remove a substantial amount of repetitive work.
Where AI Fits Into Statistical Process Control
AI is probably the most overused word in enterprise software right now. So the useful question isn't whether a platform has AI. It's what the AI actually does.
In CPV, there are some practical applications.
Historical batch data can be analyzed for patterns that may indicate emerging process drift. Anomaly detection can highlight unusual behavior that conventional statistical rules might not immediately capture. Automated trend interpretation can also help summarize what is happening across a dataset before a quality professional makes the final assessment.
AmpleLogic's CPV platform combines statistical methods with predictive analytics, anomaly detection, automated trend interpretation, and natural-language process insights.
The important part is that this doesn't remove the quality team's responsibility. Statistical signals still need scientific and quality judgment. The technology simply gives the team a faster way to see where that judgment is needed.
SPC Shouldn't Sit in a Silo
Another weakness in traditional CPV processes is the separation between statistical analysis and the rest of the quality system.
A process trend may lead to an investigation. An investigation may result in a CAPA. CPV findings may also need to contribute to the Annual Product Quality Review.
If those activities are managed in completely separate systems, someone eventually has to connect the dots manually.
AmpleLogic addresses this by connecting CPV with APQR, eQMS, LIMS, eBMR, DMS, electronic logbooks, calibration systems, and other enterprise applications. CPV findings can flow into APQR workflows, while deviations, CAPAs, and OOS/OOT events can be linked to relevant process findings.
That makes SPC part of a broader quality workflow rather than another reporting exercise.
What This Means for Pharma Manufacturers
The real value of statistical process control software pharma teams use isn't the software's ability to calculate Cp or draw an I-MR chart. Those calculations have been around for years.
The difference is what happens around them.
When process data is collected automatically, statistical analysis is standardized, unusual patterns are flagged, and findings connect back to quality workflows, teams have a much clearer view of process health.
Instead of asking, "What happened in the last CPV review?" they can start asking, "Is anything changing right now?"
That is a much more useful question.
The Bottom Line
SPC has always been about understanding variation. The challenge for modern pharma manufacturing is doing that consistently across products, batches, systems, and sites without turning every review into a manual data exercise.
A dedicated statistical process control platform can bring that work into the CPV workflow, combining real-time CPP/CQA monitoring with control charts, capability analysis, automated alerts, and audit-ready reporting. AmpleLogic's Continued Process Verification software is built around this model, with integrated statistical tools and connections to the wider quality ecosystem.
For manufacturers still moving data between spreadsheets, statistical tools, and quality systems, the next improvement may not be another report.
It may be connecting the entire process.


